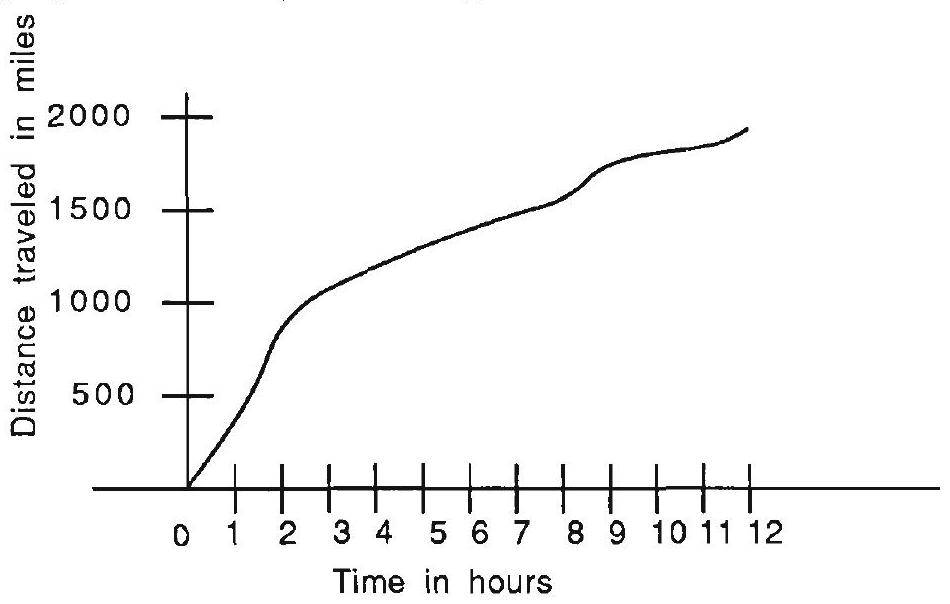
The graph relates the distance traveled [in miles] to the time elapsed [in hours] on a trip taken by an experimental airplane. During which hour was the average speed of this airplane the largest?
Answer Choices
A. first (0-1)
B. second (1-2)
C. third (2-3)
D. ninth (8-9)
E. last (11-12)