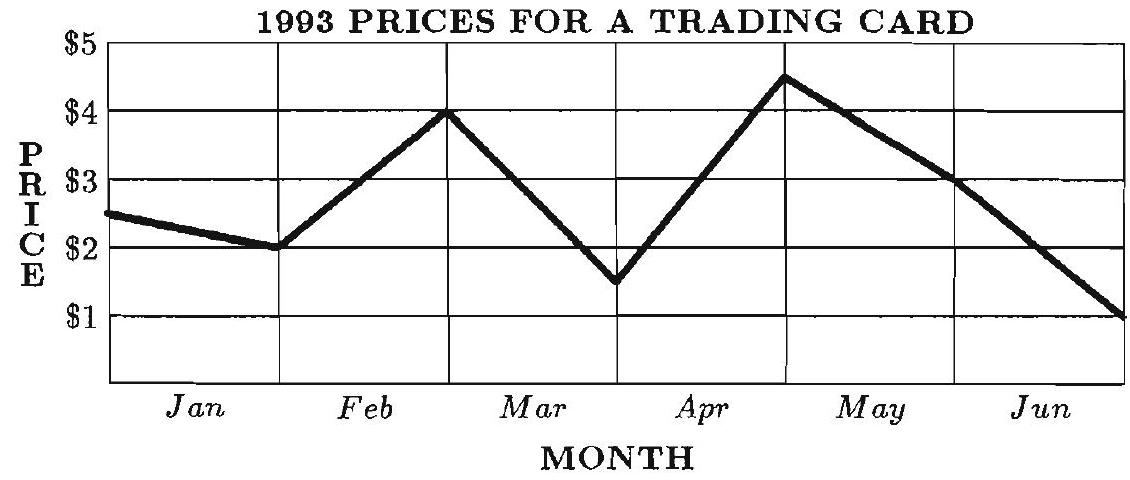
This line graph represents the price of a trading card during the first 6 months of 1993 .The greatest monthly drop in price occurred during