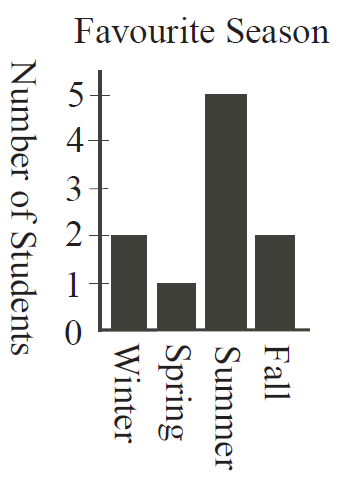
Students were surveyed about their favourite season. The results are shown in the bar graph. What percentage of the 10 students surveyed chose Spring?
Answer Choices
A. 50
B. 10
C. 25
D. 250
E. 5
Students were surveyed about their favourite season. The results are shown in the bar graph. What percentage of the 10 students surveyed chose Spring?
Answer Choices
A. 50
B. 10
C. 25
D. 250
E. 5