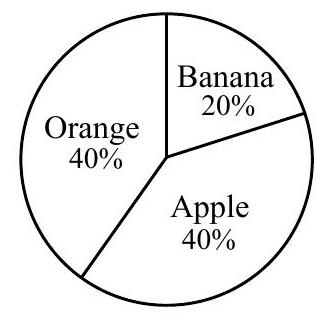
In the diagram, the pie chart shows the results of a survey asking students to choose their favourite fruit. 100 students were surveyed. How many students chose banana?
Answer Choices
A. 40
B. 80
C. 100
D. 20
E. 60
In the diagram, the pie chart shows the results of a survey asking students to choose their favourite fruit. 100 students were surveyed. How many students chose banana?
Answer Choices
A. 40
B. 80
C. 100
D. 20
E. 60