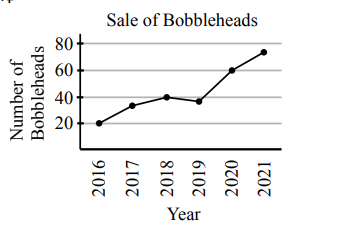
The line graph shows the number of bobbleheads sold at a store each year. The sale of bobbleheads increased the most between
Answer Choices
A. 2016 and 2017
B. 2017 and 2018
C. 2018 and 2019
D. 2019 and 2020
E. 2020 and 2021
The line graph shows the number of bobbleheads sold at a store each year. The sale of bobbleheads increased the most between
Answer Choices
A. 2016 and 2017
B. 2017 and 2018
C. 2018 and 2019
D. 2019 and 2020
E. 2020 and 2021